1. Information technology infrastructure
|
TT
|
Data
|
2009
|
2010
|
2011
|
2012
|
|
1.1
|
Number of desktop, laptop computers in use
|
4,880,800
|
5,319,000
|
5,899,830
|
6,980,353
|
|
1.2
|
Personal computers per 100 inhabitants
|
5.63
|
6.08
|
6.68
|
7.86
|
|
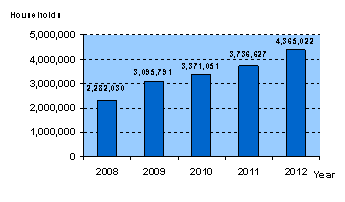
1.3. Households with computers
|
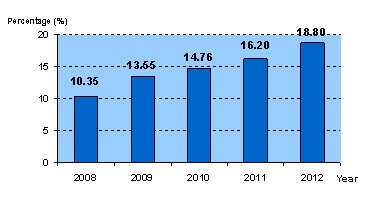
1.4. Households with computers per 100 households
|
 |
 |
Source: General Statistics Office
1.5. Information technology parks
|
|
|
2012
|
2013
|
|
1.5.1
|
Number of IT parks
|
07
|
08
|
|
1.5.2
|
Total size of land
|
710,593.3 m2
|
794,142.3 m2
|
|
1.5.3
|
Total size of office space
|
263,102 m2
|
283,156 m2
|
|
1.5.4
|
Total number of enterprises IT parks
|
over 200
|
nearly 300
|
|
1.5.5
|
Total number of IT employees in IT parks
|
over 36, 000 people
|
over 46, 000 people
|
2. Total number of registered enterprises in the IT industry sector (enterprises)
|
|
|
2009
|
2010
|
2011
|
2012
|
2013
|
|
2.1
|
Hardware industry
|
992
|
1,273
|
2,763
|
2,431
|
2,485
|
|
2.2
|
Software industry
|
1,756
|
2,958
|
7,044
|
7,246
|
6,832
|
|
2.3
|
Digital content industry
|
2,844
|
2,312
|
3,289
|
3,883
|
4,498
|
3. Information technology market
|
3.1
|
Revenue of IT industry (million USD)
|
2009
|
2010
|
2011
|
2012
|
2013
|
Growth rate
|
|
3.1.1
|
Total revenue of IT industry
|
6,167
|
7,629
|
13,663
|
25,458
|
39,530
|
55.3%
|
|
3.1.2
|
Hardware industry
|
4,627
|
5,631
|
11,326
|
23,015
|
36,762
|
59.7%
|
|
3.1.3
|
Software industry
|
850
|
1,064
|
1,172
|
1,208
|
1,361
|
12.7%
|
|
3.1.4
|
Digital content industry
|
690
|
934
|
1,165
|
1,235
|
1,407
|
13.9%
|
|
3.2
|
IT Import - Export (million USD)
|
2009
|
2010
|
2011
|
2012
|
2013
|
|
3.2.1
|
Spare parts, computers, electronic products equipment export turnover
|
3,370
|
5,666
|
10,893
|
22,916
|
34,760
|
|
3.2.2
|
Spare parts, computers, electronic products equipment import turnover
|
6,527
|
7,638
|
10,465
|
19,443
|
26,390
|
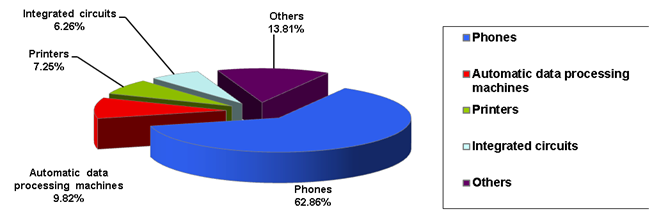
3.2.3. Hardware, electronics export by item in 2013

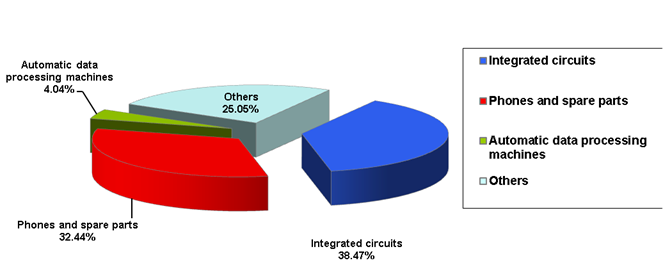
3.2.4. Hardware, electronics import by item in 2013

4. Workforce in the IT Industry
|
4.1
|
Number of employees
|
2009
|
2010
|
2011
|
2012
|
2013
|
|
4.1.1
|
Information technology industry sector
|
226,300
|
250,290
|
306,754
|
352,742
|
441,008
|
|
4.1.2
|
Hardware industry
|
121,300
|
127,548
|
167,660
|
208,680
|
284,508
|
|
4.1.3
|
Software industry
|
64,000
|
71,814
|
78,894
|
80,820
|
88,820
|
|
4.1.4
|
Digital content industry
|
41,000
|
50,928
|
60,200
|
63,242
|
67,680
|
|
4.2
|
Average of revenue per employee in the IT industry sector (USD/person/year)
|
2009
|
2010
|
2011
|
2012
|
2013
|
|
4.2.1
|
Hardware industry
|
38,582
|
44,148
|
67,555
|
110,287
|
129,213
|
|
4.2.2
|
Software industry
|
13,750
|
14,816
|
14,855
|
14,957
|
15,334
|
|
4.2.3
|
Digital content industry
|
16,829
|
18,339
|
19,352
|
19,615
|
20,789
|
|
4.3
|
Average of wage per employee in the IT industry sector (USD/person/year)
|
2009
|
2010
|
2011
|
2012
|
2013
|
|
4.3.1
|
Hardware industry
|
1,809
|
2,201
|
2,279
|
2,281
|
2,301
|
|
4.3.2
|
Software industry
|
4,093
|
5,123
|
5,034
|
5,009
|
5,025
|
|
4.3.3
|
Digital content industry
|
3,505
|
4,896
|
5,267
|
5,201
|
5,268
|
