1. Broadcasting
1.1. Broadcasting platform
|
|
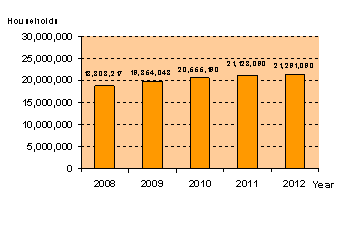
1.1.1. Households with a colour television
|
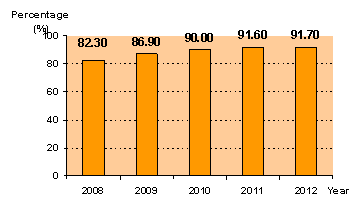
1.1.2. Households with a colour television per 100 households
|
|||||
|
|
 |
 |
|||||
|
No.
|
Classification
|
2012
|
2013
|
Details
|
|
||
|
1.1.3
|
Number of pay TV subscribers
|
9,025,000
|
6,679,646
|
|
|
||
|
1.1.3.1
|
NumberofcableTVsubscribers
|
4,412,000
|
5,572,772
|
|
|
||
|
1.1.3.2
|
Numberofterrestrialdigital TVsubscribers
|
3,640,000
|
120,000
|
|
|
||
|
1.1.3.3
|
Numberofsatellitedigital TV subscribers
|
973,000
|
986,874
|
|
|
||
|
1.1.4
|
Radio – TV Broadcasters
|
|
|
|
|
||
|
1.1.4.1
|
Number of Radio, TV and Radio-TV Broadcasters
|
67
|
67
|
VTV, VOV, VTC, Ha Noi TV, HTV, Da Nang TV,...
|
|
||
|
1.1.4.2
|
Number of broadcasters without transmission broadcasting platform
|
6
|
7
|
|
|
||
|
1.1.5
|
Total number of TV and radio channels
|
|
|
|
|
||
|
1.1.5.1
|
Number of free-to- air TV channels
|
99
|
104
|
|
|
||
|
1.1.5.2
|
Number of free-to- air radio channels
|
73
|
75
|
|
|
||
|
1.1.5.3
|
Number of pay TV channels
|
75
|
40
|
|
|
||
|
1.1.5.4
|
Number of radio channels on pay TV systems
|
5
|
9
|
|
|
||
1.2. Number of pay TV service providers
|
No.
|
Classification
|
2012
|
2013
|
Details
|
|
1.2.1
|
NumberofcableTVservice providers
|
27
|
33
|
SCTV, VTVCab, VNPT, HTV-TMS*, Viettel, etc.
|
|
1.2.2
|
Numberofterrestrialdigital TVservice providers
|
3
|
3
|
VTV, VTC, AVG
|
|
1.2.3
|
Numberofsatellitedigital TV service providers
|
3
|
3
|
VSTV (K+), VTC, AVG
|
1.3. Broadcasting market
1.3.1 .Revenue of pay TV service (million USD)
|
|
|
2012
|
2013
|
|
1.3.1.1
|
Total revenue of pay TV service
|
200.20
|
276.43
|
|
1.3.1.2
|
Revenue of cable TV service
|
193.74
|
227.47
|
|
1.3.1.3
|
Revenue of terrestrial digital TV service
|
1.52
|
4.75
|
|
1.3.1.4
|
Revenue of satellite digital TV service
|
4.94
|
44.21
|
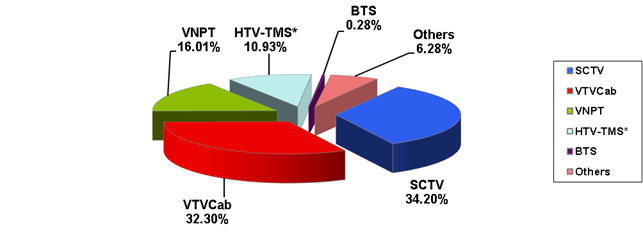
1.3.2. Market shares (by subscriber) of pay TV service providers in 2013
1.3.2 .1. Market shares (by subscriber) of cable TV service providers

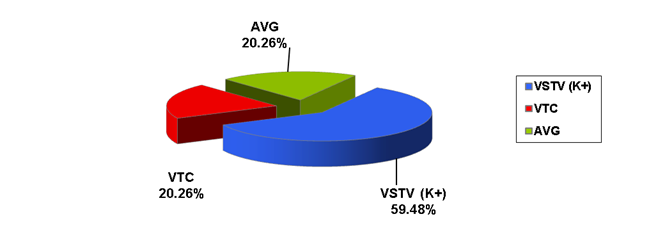
1.3.2.2. Market shares (by subscriber) of satellite digital TV service providers

1.4. Broadcasting workforce
|
|
2009
|
2010
|
2011
|
2012
|
2013
|
|
Number of employees in radio broadcasters, TV broadcasters and radio -TV broadcasters
|
-
|
-
|
10,054
|
10,854
|
11,218
|
2. Electronic Information
|
No.
|
Classification
|
2012
|
2013
|
|
2.1
|
E-newspapers and websites of press organizations
|
||
|
2.1.1
|
Number of e-newspaper organizations
|
72
|
90
|
|
2.1.2
|
Number of websites of press organizations
|
196
|
215
|
|
2.2
|
Websites
|
||
|
2.2.1
|
Number of licensed websites (except press organizations)
|
963
|
1,091
|
|
2.2.2
|
Number of licensed online social networks
|
333
|
420
|
|
2.3
|
Games online
|
||
|
2.3.1
|
Number of games online by approved script contents
|
76
|
82
|
|
2.3.2
|
Number of enterprises supplying games online
|
25
|
30
|
